Data Visualization
with Responsive D3.js
2004

2017
Front End Developer
Flash Developer

consulting

Data visualization back then
The vinzer project
Flash.Is.Dead


Why was it so popular?
- Simple to use and animate
- Vector graphic & streaming video
- Browsers were simply NOT there to compete


What is D3?
Data
Driven
Documents
D3 is NOT
-
Chart Library
-
render things for you
-
for IE8 & below (use sizzle for compatibility)
D3 is...
- a combination of building blocks (modules)
- great tool for mapping data to the DOM
- transform the data
- Smooth transition between UI states

D3 in the web
The refugee project
There are many websites built based on D3
D3 Set up
- Use loader from the website
*I use bower to install all packages
<script src="https://d3js.org/d3.v4.min.js"></script>- Minified version
- NPM
npm install d3<script src="https://d3js.org/d3.v4.min.js"><script src="https://d3js.org/d3-time.v1.min.js"></script>
<script>
var day = d3.timeDay(new Date);
</script>- Default bundle
import { extent } from "d3-array";Using modules vs default bundle
- Module
- Function
What do you need to know ?

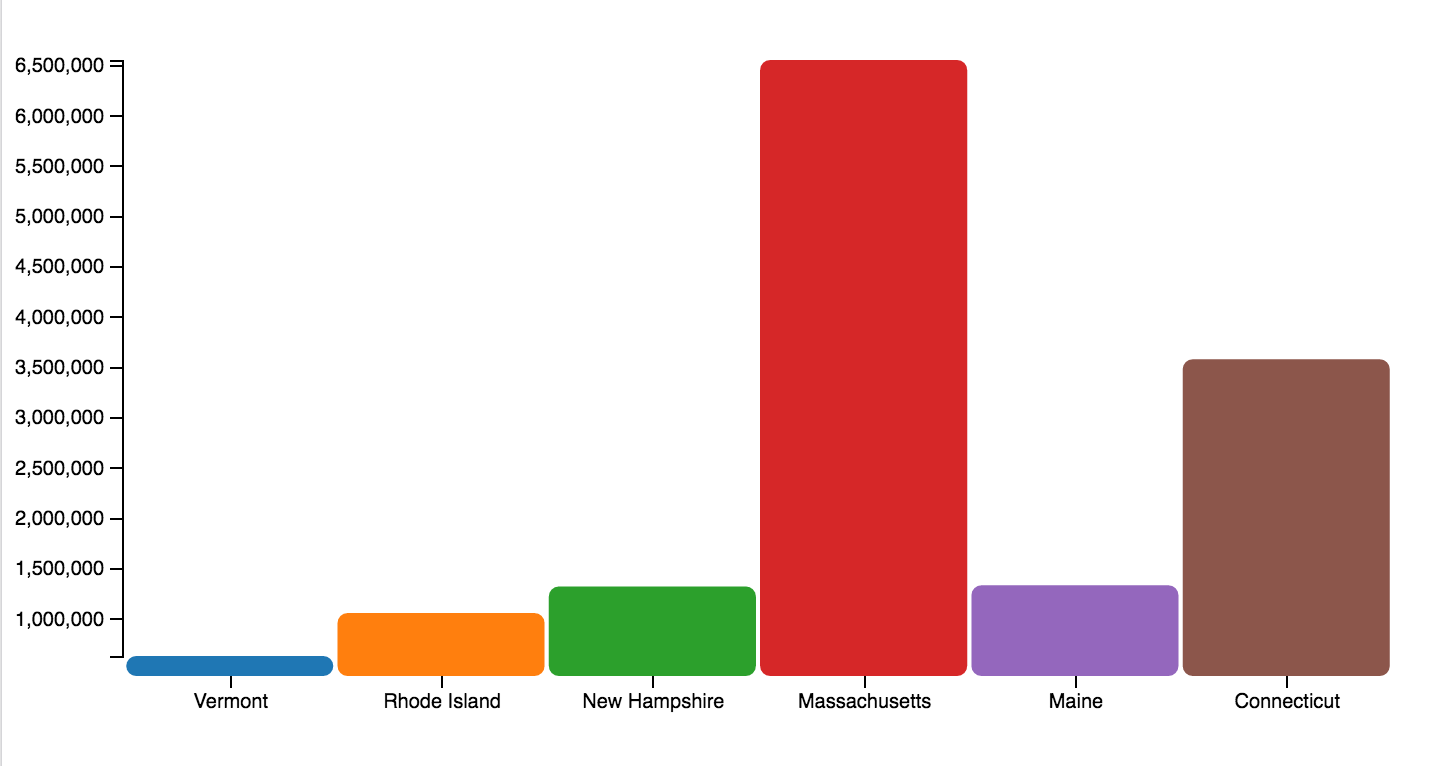
Let's make a chart
Initial visualization decision based on data
- What is independent variable?
- What is dependent variable?
| State | Population |
|---|---|
| Vermont | 625741 |
| Rhode Island | 1052567 |
| New Hampshire | 1316470 |
| Massachusetts | 6547629 |
| Maine | 1328361 |
| Connecticut | 3574097 |
define SVG viewport
define axis
Bind data
SVG rectangles
Scale data
0
6.500.000
5.500.000
4.500.000
3.500.000
2.500.000
1.500.000
500.000
set domain
names of the states
set range
width of the chart
choose data representation
bar chart
Find data
Sections
Data
Selections
Data Join
SVG
Scales
Axis
Responsive
Complete chart
Final result is here
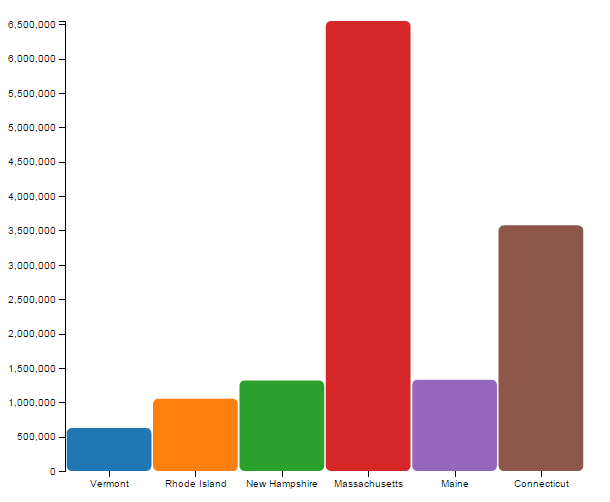
Population of New England by state
Data
Selections
Data Join
SVG
Scale
Axis
Responsive
<svg width="300" height="300">
  <rect x="25" y="50" width="50" height="200" />
  <rect x="75" y="50" width="50" height="200" />
  <rect x="125" y="50" width="50" height="200" />
</svg>
Data
Data can be represented in many ways
as an array
use length of myData to create rectangles
var myData = [25, 75, 125];
or as SVG rectangles that use myData for x
renders like this
Human readable data interchange
D3 and JSON
JS object
JSON object
var myData = {x: 5, "y!": 5};var myData = {"x": 5, "y": 5};vs.
both of them contain a “key: value” pair
key in JSON must be enclosed in double quotes.
in JS object key needs "" only when you use a special character
Why is that so important to keep data in json object?
D3 and JSON
- XMLHttpRequest
- text file
- JSON
- HTML
- XML
- CSV file
- TSV file
D3 can read all these formats, as long and you can construct an array
var myData = [{
            "name": " Massachusetts",
            "population": 6547629
}];myData.name;
in console:

// Massachusetts
3
1316470
New Hampshire
6547629
Massachusetts
19378102
New York

2
1
myData = [{
            "name": " Massachusetts",
            "population": 6547629
          },
          {
            "name": "New Hampshire",
            "population": 1316470
          },
          {
            "name": "New York",
            "population": 19378102
          }];
Selections
Data Join
SVG
Scale
Axis
Responsive
Data
Selection
select();Selects elements and attaches data
selects only the 1st matching element in the DOM
d3.select("p");
d3.selectAll("p");
selects All matching elements in traversal order
d3.select(".chart").selectAll("p");
Selections are nested.
Very similar to JQuery, D3 uses selector chaining
<div class="chart">
    <p>Chart will be here</p>
    <p>Soon...</p>
</div>
d3.selectAll("p");//[ [<p>], [<p>] ]
//console
zi {_groups: Array[1], _parents: Array[1]}
group
selection
p
check "How Selections Work"
Selection: subclass of array
d3.selectAll("p");
selection returns a group containing the selected element
Selection can use regular JS methods
.size();
.length();
d3.selectAll("circle").attr("r", 25);
element
class/id
attribute
d3.select(".row:first-child");
d3.select("input[type=checkbox]")
  .checked(true);
CSS3 as a selection tool
var tooltip = d3.select(".tooltip");
tooltip.on("mouseover", function(d,i) { alert("mouseover"); });
D3 can capture user events
d3.select("body").attr("class", "container").style("color", "red");d3.attr();
d3.style();
d3.property();
d3.classed();
d3.html();
d3.text();
set or modify attributes, styles, properties, HTML or text content
Selection
Chart will be here
soon...
Chart will be here
soon...
before
after
.call();
calls a function on the selection
Control Flow:
function showAlert() {
  alert("hi");
}
var callSelection = d3.select("body").call(showAlert);
Elements can be added or removed from a selection
.append();
a new element as a last child of the selection
Selection
d3.select("body")
    .append("div")
.text("added a new div");.insert();
similar to append, but can be inserted before specified element.
d3.insert("p", "div")
.text("I am before div");.remove();
once the selection is removed you can't put it back
svg.remove("circle");
Chart Milestone: Selection
Data Joins
SVG
Scale
Axis
Responsive
Data
Selections
<div>25</div>

<div>75</div>

<div>125</div>
Data Join
25
75
125
myData
var myData = [25,75,125];
can represent 1 datum of the array with a div
var myData = [1,25,75,45,150];
bigger array == more divs
<div>1</div>
<div>25</div>
<div>75</div>
<div>45</div>
<div>150</div>
var myData = [1,25];
smaller array == less divs
<div>1</div>
<div>25</div>
Data Join Terminology
var myData = [1,25,75,45,150];
var myData = [1,25];
Entered 1, 25, 75
var myData = [1,25,75];
Updated 1, 25, 75 and Entered 45, 150
Updated 1, 25 and Removed 75, 45, 150
<div>1</div>
<div>2</div>
<div>3</div>
Data Join
join specifies array of data with current selection . In d3 d stands for datum and i for the index
.data();Binds 1 datum with 1 element in the selection
1
2
3
myData
var myData = [1,2,3];
d3.selectAll('div').data(myData);
returns a new update selection, means all data points were successfully bound to the elements
selection.data();
Create a data join
1. Select an element that you want to bind to
var dataJoin = d3.selectAll('div');
var myData = [1,2,3];
dataJoin.data(myData);
2. Attach data to a selected element
Data Join
var myData = [1,2,3];
d3.selectAll('div').data(myData);
no changes in the DOM, why?
If you run this code in the console:
Data Join
Data stored in __data__ property.
Data Join States
Elements for which the data previously existed
.data();
Update
Create a new element
.enter();
Enter
Remove an element
.exit();
Exit
Different types of selections based on a state
Data Join
Once new selection was returned we can call .enter() or .exit()
var bar = d3.selectAll(".bar").data(data);
bar.enter().append("div").attr("class", "bar");
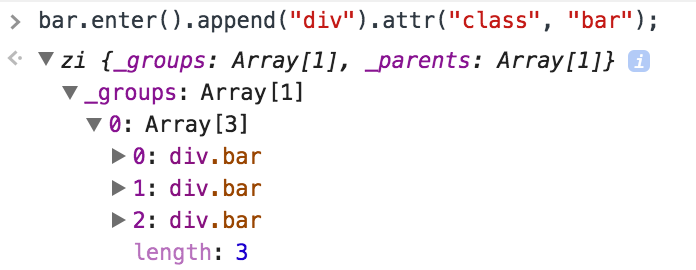
Data Join
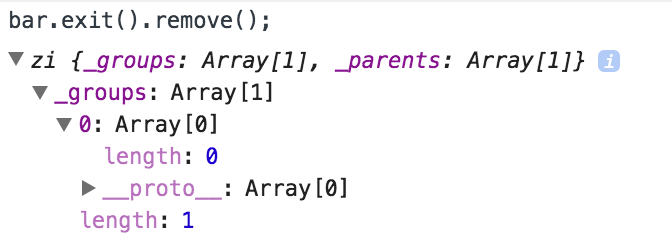
exit selection is determined by the previous selection. Extremely useful for animation. When animation is done -> remove an element.
bar.exit().remove();
General Visualization Pattern
d3.selectAll('div')
.data(data)
.enter()
.append("div");
check Mike Bostock's General Update Pattern
select the element
bind the data
create a placeholder
return a new selection containing the element
DOM Elements Based On Data
var data = [10,20,30];
1. Define the data
d3.selectAll(".bar")
       .data(data)
       .enter()
       .append("div")
       .text(function(d, i){
         return d;
       });
2. Select the element
3. Bind data to the element
4. Create a DOM element
5. Output the data on the screen
Chart Milestone
var data = [
    {name: 'Vermont', value: 625741},
    {name: 'Rhode Island', value: 1052567},
    {name: 'New Hampshire', value: 1316470},
    {name: 'Massachusetts', value: 6547629},
    {name: 'Maine', value: 1328361},
    {name: 'Connecticut', value: 3574097}
];
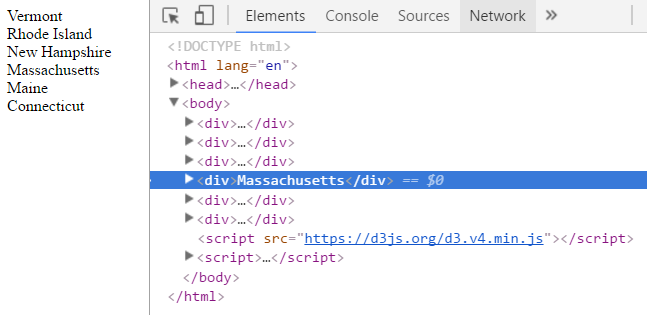
d3.select("body")
   .data(data)
   .enter()
   .append("div")
   .text(function(d){
      return d.name;
});
SVG
Scale
Axis
Responsive
Data
Selections
Data Join
<svg xmlns="http://www.w3.org/2000/svg"
     width="500" height="40" viewBox="0 0 500 40">

  <text x="0" y="35" font-family="Verdana" font-size="35">
    Hello, out there
  </text>
</svg>
SVG
SVG stands for scalable vector graphic, defined in XML file.
Hello, out there
<svg width="300" height="300">
  <rect x="50" y="50" width="150" height="150"/>
</svg>
<svg width="300" height="300">
<path d="M0,0 150,0 150,50 0,50" style="fill:red;" />
</svg>SVG basic shapes
Path is a shape to build all shapes. "d" attribute has "path mini language
renders as
renders as
Static SVG
<svg width="300" height="300">
    <rect x="50" width="20" y="150" height="200"></rect>
    <rect x="100" width="20" y="150" height="200"></rect>
    <rect x="150" width="20" y="150" height="200"></rect>
</svg>
Basic STATIC rectangle in HTML
Renders as
what is you need to update an attribute for each rect?
SVG & <g>
<g> element used for grouping elements and transforming them as a unit
<svg width="300" height="300">
  <rect x="50" width="20" y="150" height="200" fill="red"></rect>
  <rect x="100" width="20" y="150" height="200" fill="red"></rect>
</svg>
all children will get the style
<svg width="300" height="300">
  <g fill="red">
     <rect x="50" width="20" y="150" height="200"></rect>
     <rect x="100" width="20" y="150" height="200"></rect>
  </g>
</svg>
We can wrap rectangles into <g> element, apply styles to it
D3 can render SVG
D3 can generate SVG basic shapes on the fly
var svg = d3.select("body")
            .append("svg")
            .attr("width", "300")
            .attr("height", "300");
define SVG container
svg.append("rect")
      .attr("x", 150)
      .attr("width", 50)
      .attr("y", 150)
      .attr("height", 200)
      .attr("fill", "pink");
attach rectangle via D3
Renders as
var svg = d3.select("body")
            .append("svg")
            .attr("width", "300")
            .attr("height", "300");

svg.append("g").attr("fill", "red")
               .append("circle")
               .attr("cx", "50")
               .attr("cy", "50")
               .attr("r", "25");
D3 & <g>
Use D3 to create elements and apply styles on the fly
Renders as
SVG viewport
D3 and SVG coordinate space
var svg = d3.select("body")
            .append("svg")
            .attr("width", "300")
            .attr("height", "300");

var circle = svg.append("circle")
                .attr("cy", 5)
                .attr("cx", 5)
                .attr("r", 25);
SVG generated via D3 starts drawing from the top left corner
Basic shape is visible Only within SVG dimensions
y
x
Circle starts drawing x:5 y:5 of SVG viewport
0
100
100
50
0
100
100
50
svg.append("g")
    .attr("transform", "translate(50,50)")
    .append("circle")
    .attr("cx", "50")
    .attr("cy", "50")
    .attr("r", "25");
translate moves svg by 50 pixels
D3 & SVG group transform
apply "transform", "translate(50,50)"
to move a circle 50px down and 50 px to the right
define a new coordinate system by applying transform property
50
50
0
600
500
SVG viewport
0
600
500
new drawing area
SVG + margin
0
Margin conversion
apply margin conversion to SVG viewport to avoid cutting elements
var margin = {top: 20, right: 20, bottom: 30, left: 60},
    width = 600 - margin.left - margin.right,
    height = 500 - margin.top - margin.bottom;
var svg = d3.select("body").append("svg")
.attr("width", width + margin.left + margin.right)
.attr("height", height + margin.top + margin.bottom)
.append("g")
.attr("transform", "translate(" + margin.left + "," + margin.top + ")");Margin Conversion Via D3
Define margin, width and height
apply attribute transform to <g> element to give a space to render svg elements
data = [{"x": 5, "y": 5},{"x": 50, "y": 50},{"x": 100, "y": 100}];

var svg = d3.select("body")
            .append("svg")
            .attr("width", "300")
            .attr("height", "300");

svg.selectAll(".bar")
   .data(data)
   .enter().append("rect")
                .attr("rx", 5)
                .attr("ry", 5)
                .attr("x", function(d) { return d.x; })
                .attr("width", 20)
                .attr("y", function(d) { return d.y; })
                .attr("height", 50);
Dynamic SVG
D3 can generate SVG based on data
Chart Milestone: Draw SVG
Scales
Axis
Responsive
Data
Selections
Data Join
SVG
think of maps 100 km: 1 point
Scales
maps a dimension of abstract data to a visual representation
DOMAIN is what we are mapping From :100km
RANGE is what we are mapping TO: 1 point
Scales
var data = [625741, 1052567, 1316470];
range
domain
0
5
10
domain:[625741, 1052567, 1316470];
range:[0,5,10];
Scales
how to find min and max of the data points?
return array of min and max
.extent();
.max();
returns max number
var data = [1, 2, 3, 5, 20, 57, 1];
d3.extent(data); //[1, 57]
var data = [1, 2, 3, 5, 20, 57, 1];
d3.max(data); //[57]Types of scales
Continuous (Linear, Power, Log, Identity, Time)
Ordinal (Band, Point, Category)
map a continuous, quantitative input domain to a continuous output range.
discrete input domains, such as names or categories.
Other (Sequential Quantize Quantile Threshold)
Continuous Scale: Linear
var data = [
    {name: 'Rhode Island', value: 1052567},
    {name: 'Maine', value: 1328361}
];
for continuous numerical input
1052567 1328361
range
domain
0
500
height of SVG
Linear Scale
var y = d3.scaleLinear()
    .range([500, 0]);
for continuous numerical domain
with the unit domain [0, 1], the unit range [0, 1],
d3.scaleLinear();
can be any number
.domain();
output range is continuous and numeric
.range();
Linear Scale
Range: use fixed numbers or define the range based on screen size
var data = [
    {name: 'Rhode Island', value: 1052567},
    {name: 'Maine', value: 1328361}
];
var y = d3.scaleLinear()
.range([500, 0]);
y.domain([0, d3.max(data, function(d)
{ return d.value; })]);
//console
y(600000);
285.7142857142857Domain: from 0 to the maximum value of data.value
Ordinal scale: band
it's an ordinal scale that takes discrete input such as names, numeric output
Rhode Island
Maine
var data = [
    {name: 'Rhode Island', value: 1052567},
    {name: 'Maine', value: 1328361}
];
1
2
output
Band scales:
constructs a scale with an empty domain and range
d3.scaleBand();
takes discrete values such as names of the states.
.domain();
output range is continuous and numeric
.range();
d3.scaleBand()
    .domain(["Rhode Island", "Maine"])
    .range([0, 100]);
it's an ordinal scale that takes discrete input such as names, numeric output
Band scales
output separated into equal "bands" with some padding in between
for blank space between bands
.padding(0.02);
Rhode Island
Maine
d3.scaleBand()
    .domain(["Rhode Island", "Maine"])
    .range([0, 100]);
Band
Band
Band scales
how to set up domain and range from the data?
var data = [
    {name: 'Rhode Island', value: 1052567},
    {name: 'Maine', value: 1328361}
];
var x = d3.scaleBand()
.range([0, width])
.padding(0.02);
x.domain(data.map(function(d) { return d.name; }));Range: use fixed numbers or define the range based on screen size
Domain: names of the state
Category scales:
Constructs a new ordinal scale with a range categorical colors


.schemeCategory10
.schemeCategory20
.schemeCategory20b
.schemeCategory20c
1. Category scales use d3-scale-chromatic.module
2. Use set of colors provided by Color Brewer
Category scales
D3 ordinal scale with a range of categorical colors
var color = d3.scaleOrdinal(d3.schemeCategory10);

svg.selectAll(".bar")
    .data(data)
    .enter().append("rect")
    .attr("fill", function(d,i) { return color(i % data.length); });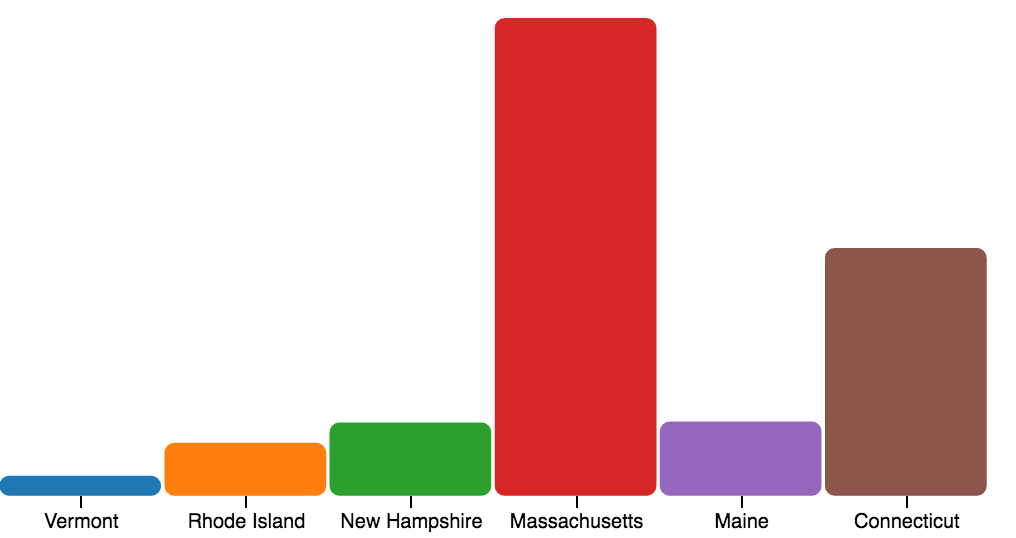
Chart milestone: Scale SVG
Axis
Responsive
Data
Selections
Data Join
SVG
Scale
Axis
Earlier I claimed that D3 is not good for rendering things for you...
Well, D3 can provide axis for you!
1. Set up a container for axis (SVG viewport)
2. Define a scale with a range & domain.
3. Append axis to svg
Axis
var margin = {top: 20, right: 20, bottom: 30, left: 60},
    width = 600 - margin.left - margin.right,
    height = 500 - margin.top - margin.bottom;
1. Set up a container for axis (SVG viewport)
Axis
var x = d3.scaleBand().range([0, width]).padding(0.02);

var y = d3.scaleLinear().range([height, 0]);

var xAxis = d3.axisBottom(x);
var yAxis = d3.axisLeft(y);
2. Use scale to transform the data for axis
Axis
  svg.append("g")
      //add classes for styling
      .attr("class", "x_axis")
      //move xAxis: x: 0 y:from the top down to the height
      .attr("transform", "translate(0," + height + ")")
      .call(xAxis);

 svg.append("g")
      //add classes for styling
      .attr("class", "y_axis")
      //we don't want to shift up or down
      .call(yAxis);
3. Call axis when you create SVG
Axis
Axis component has some useful methods:
.axisTop();
D3 reserves the right to override the number of each tick if the number won't come out clean after scaling
.axisBottom();
.axisLeft();
.axisRight();
.axis.ticks();
Chart Milestone: Add Axis
Let's make it responsive
Data
Selection
Data Join
SVG
Scales
Axis
Responsive charts
most visualizations are built for large screens
the refugee project or mayoral race campaign

Responsive charts
Option one: Make SVG responsive
preserveAspectRatio="xMinYMin meet" viewBox="0 0 800 960"Option two: SVG re-draw depends on the screen size
//get dimensions based on window size
updateDimensions(window.innerWidth);

function updateDimensions(winWidth) {
  width = winWidth - margin.left - margin.right;
  height = .5 * width; //aspect ratio is 0.5
}Responsive charts
Render the chart on resize
1. Create a render function that re-calculates height and width based on screen size
function render() {
    /* Define a new width and height */
    ...
}

window.addEventListener('resize', Chart.render);
2. Add an event listener to re-render the chart when event is fired
Responsive charts
DON'T use fixed height
Use aspect ratio instead of px
height = .4 * width; //aspect ratio is 0.4use breakpoints to modify visualization
var breakPoint = 768;
// in render function
if(width < breakPoint) {
    ...
} else {
    ...
}
Final result is here
Where to go from here?
Load data from the server using Python
Try D3 layouts
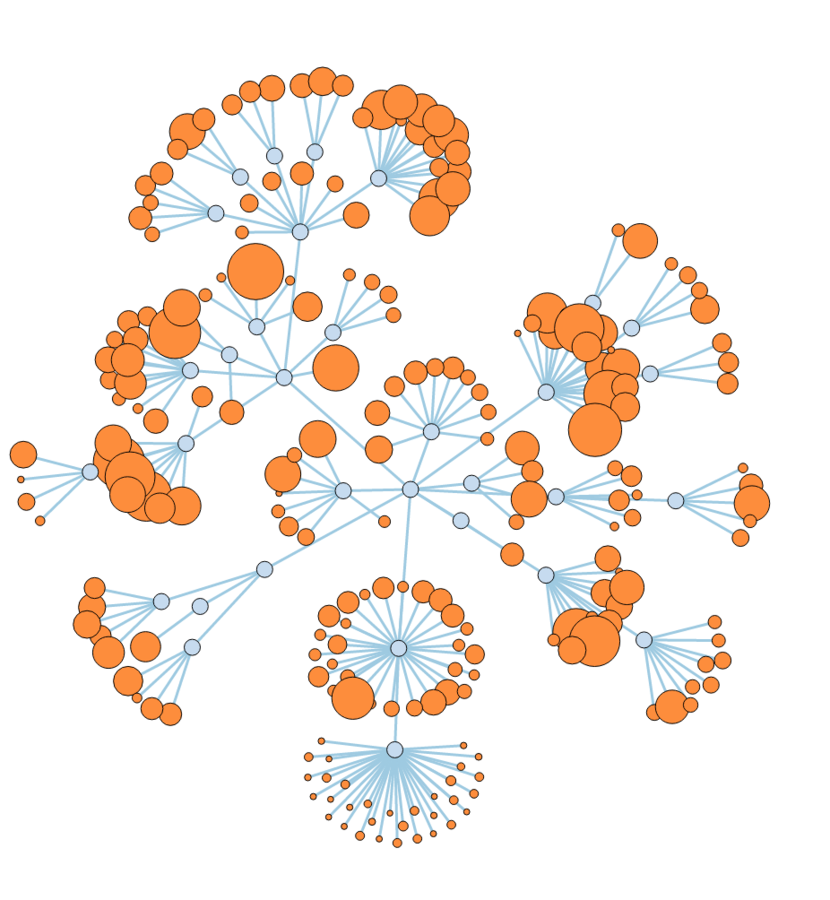
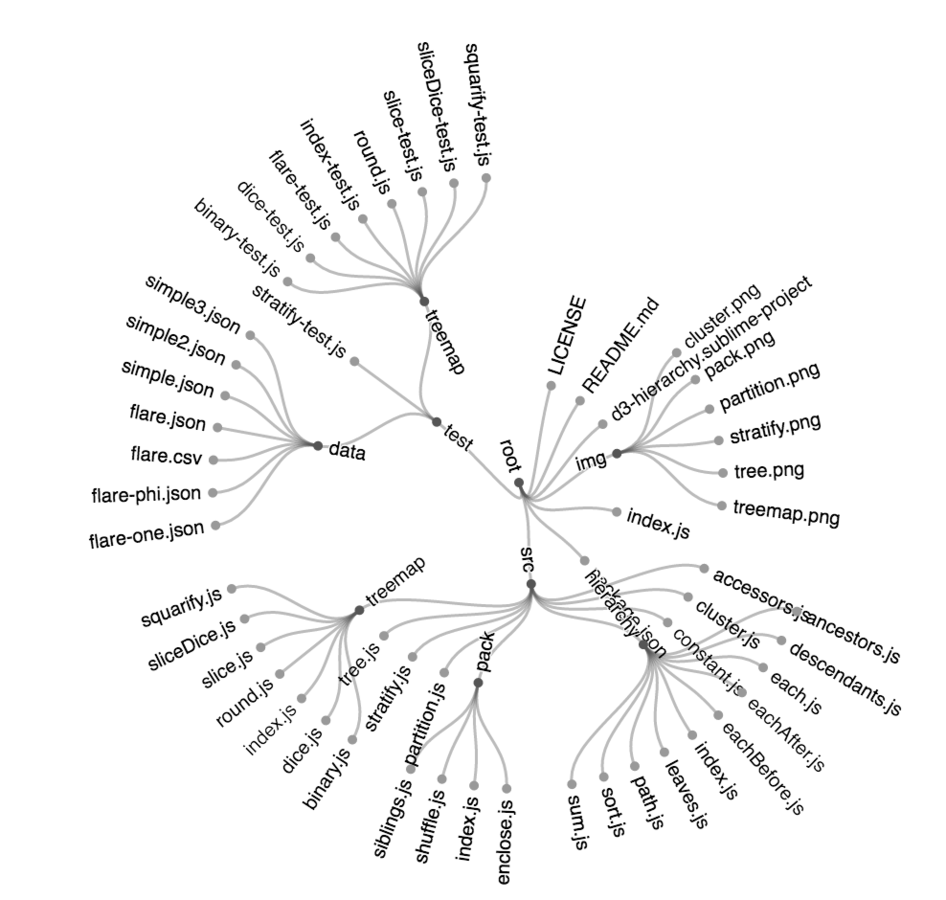
Hierarchy
Force
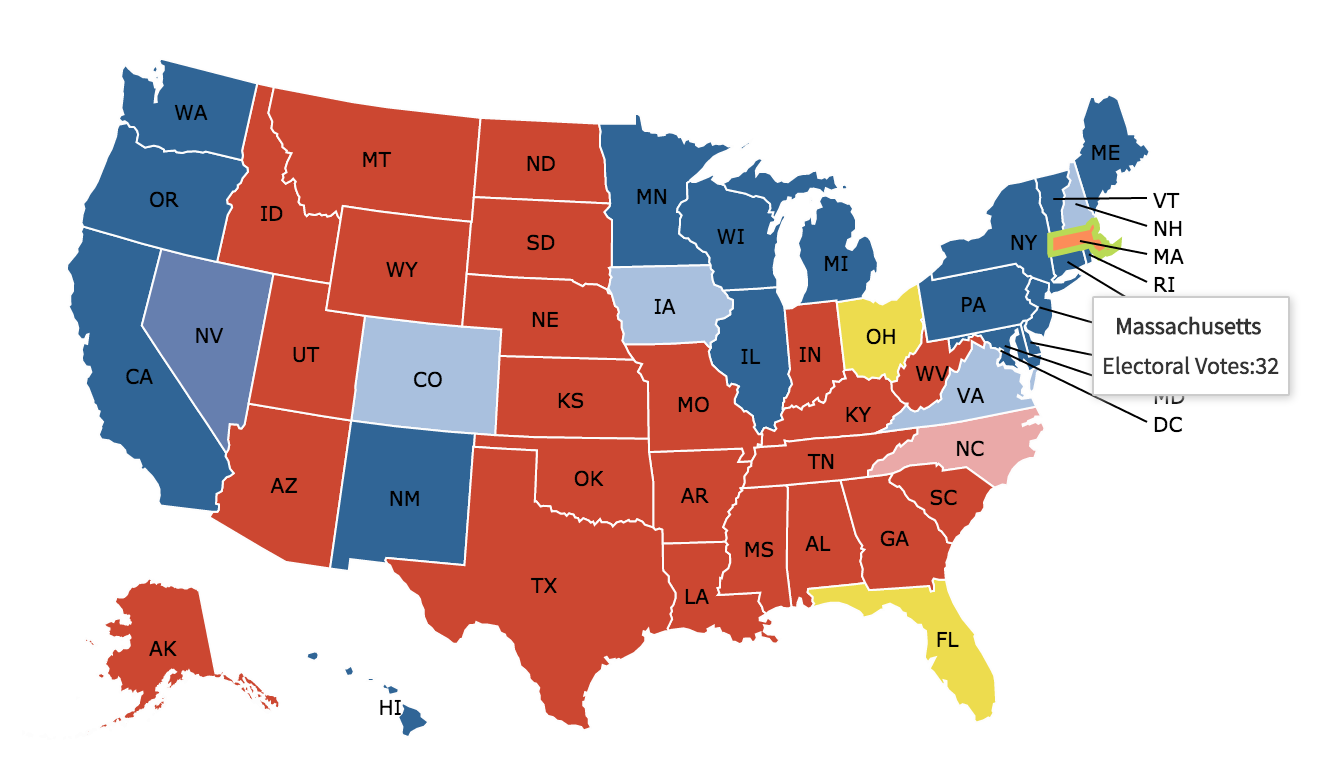
Map
References
Mike Bostock's website
Mike Bostock's blocks
Building Responsive Data Visualizations with D3.js
DashingD3js Screencasts
D3.js tutorials
Thanks!
Iuliia Amodeo Konivetska
taurusj.k2@gmail.com
@taurusJ_K
Data Visualization with responsive D3.js
By Iuliia Konivetska
Data Visualization with responsive D3.js
Strange loop workshop
